Introducing New Analytics Dashboard
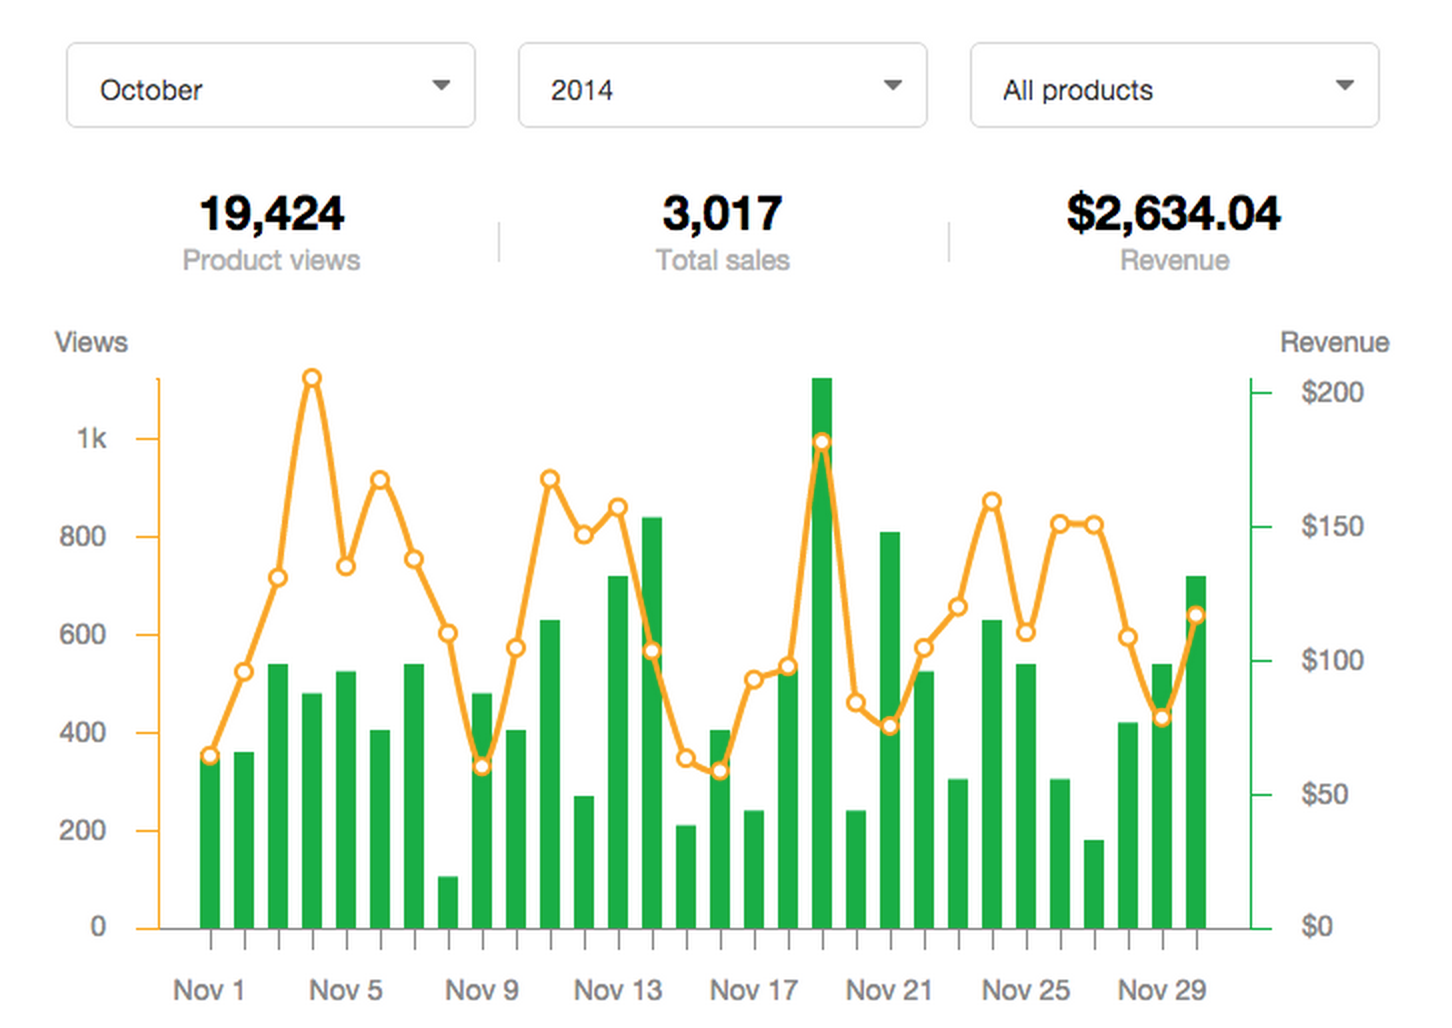
With new improved Sellfy analytics dashboard you can keep track of all your product metrics, including views, sales and revenue in one place. Track the combined metrics of all the products in your store, our dive deep into stats for individual products. Check how well have your products performed this month or any other period since you joined Sellfy.

Traffic Sources
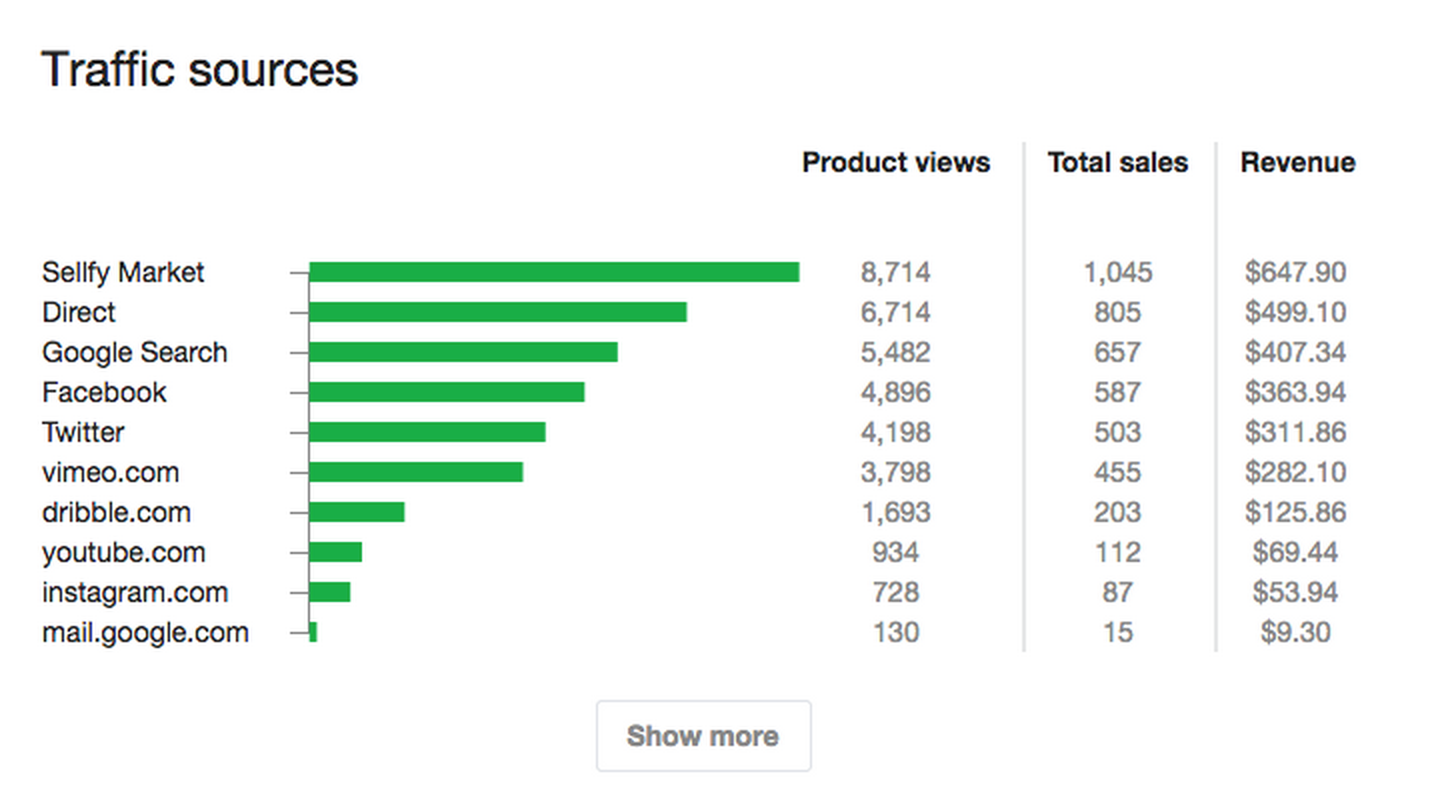
Now you can see exactly how much views and sales every channel drives for your products. Find out how many customers are coming from Google search or find out how effective is your Sellfy market placement. By default we only show top 10 channels, but you can easily display more by clicking the “Show more” button at the bottom of the “Traffic sources” section.

Direct traffic source
You may have noticed that one of your traffic sources is listed as Direct. Apart from users who directly typed in your product page URL into their browser’s address bar, this includes all viewers who clicked on your product link outside of their browsers.
This usually means that these visits are coming from one of the following places:
- email clients
- Twitter clients (like Tweetdeck)
- Instant messengers (like Skype)
- PDFs (like when you include a link to your store)
Traffic by location
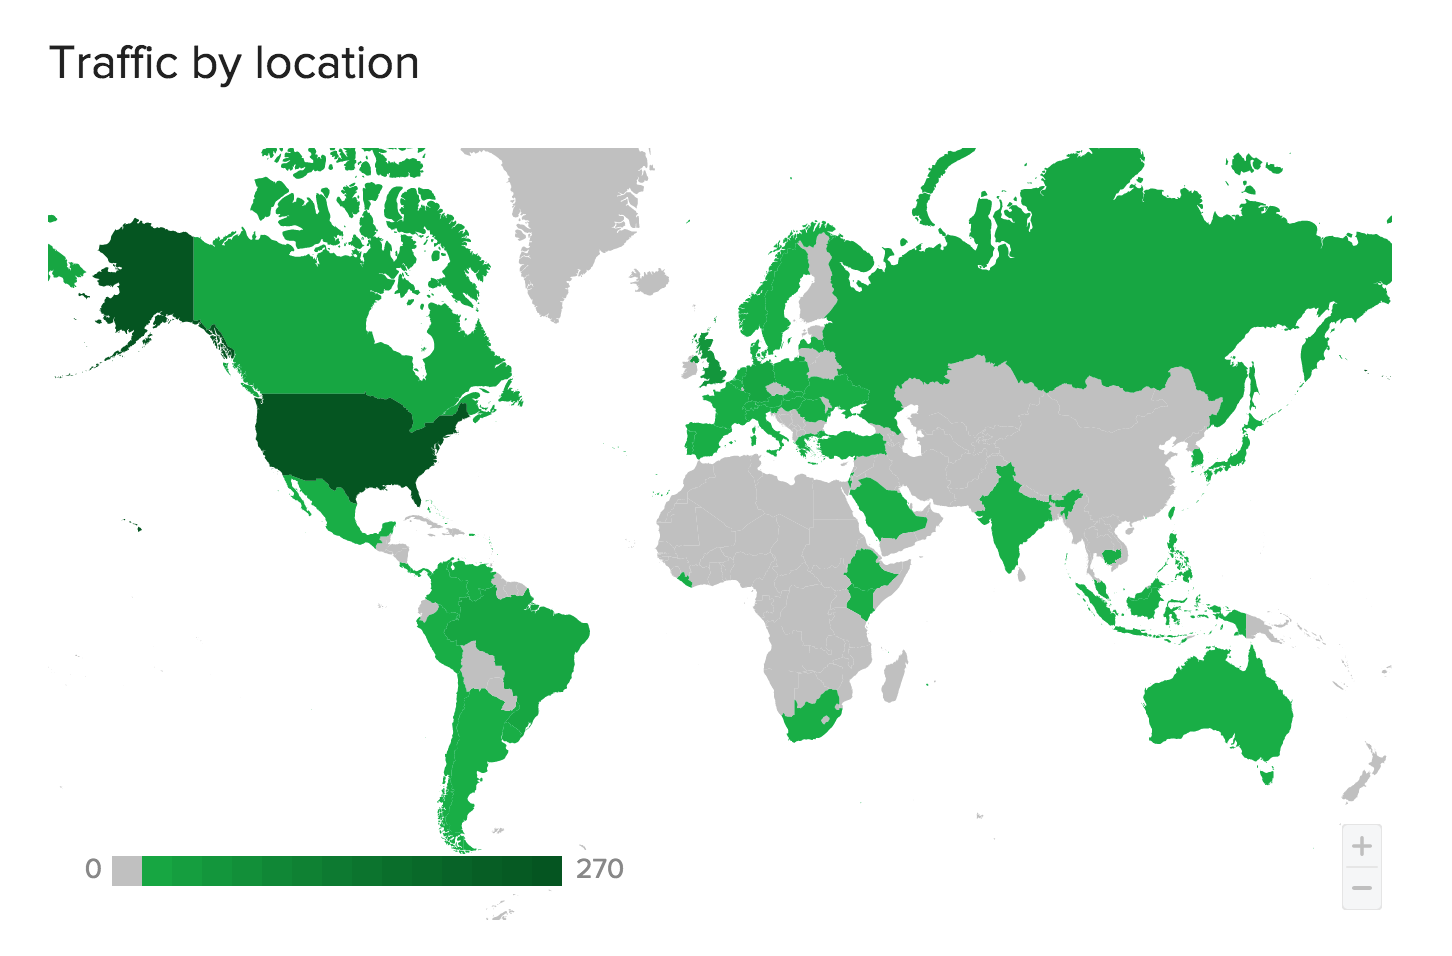
Learn what countries bring you the most views, sales and ultimately – revenue. Hover over individual countries to see detailed statistics about sales, views and revenue coming from that country. This is also useful if you still haven’t decided how to react to new EU VAT rules.

Over to you
Closely monitoring the analytics behind your products is important if you want to evaluate the effectiveness of your sales techniques. With proper application, this can help you plan and execute future marketing activities.
Have you already tried new Sellfy analytics dashboard? Is there something you think we should improve?


